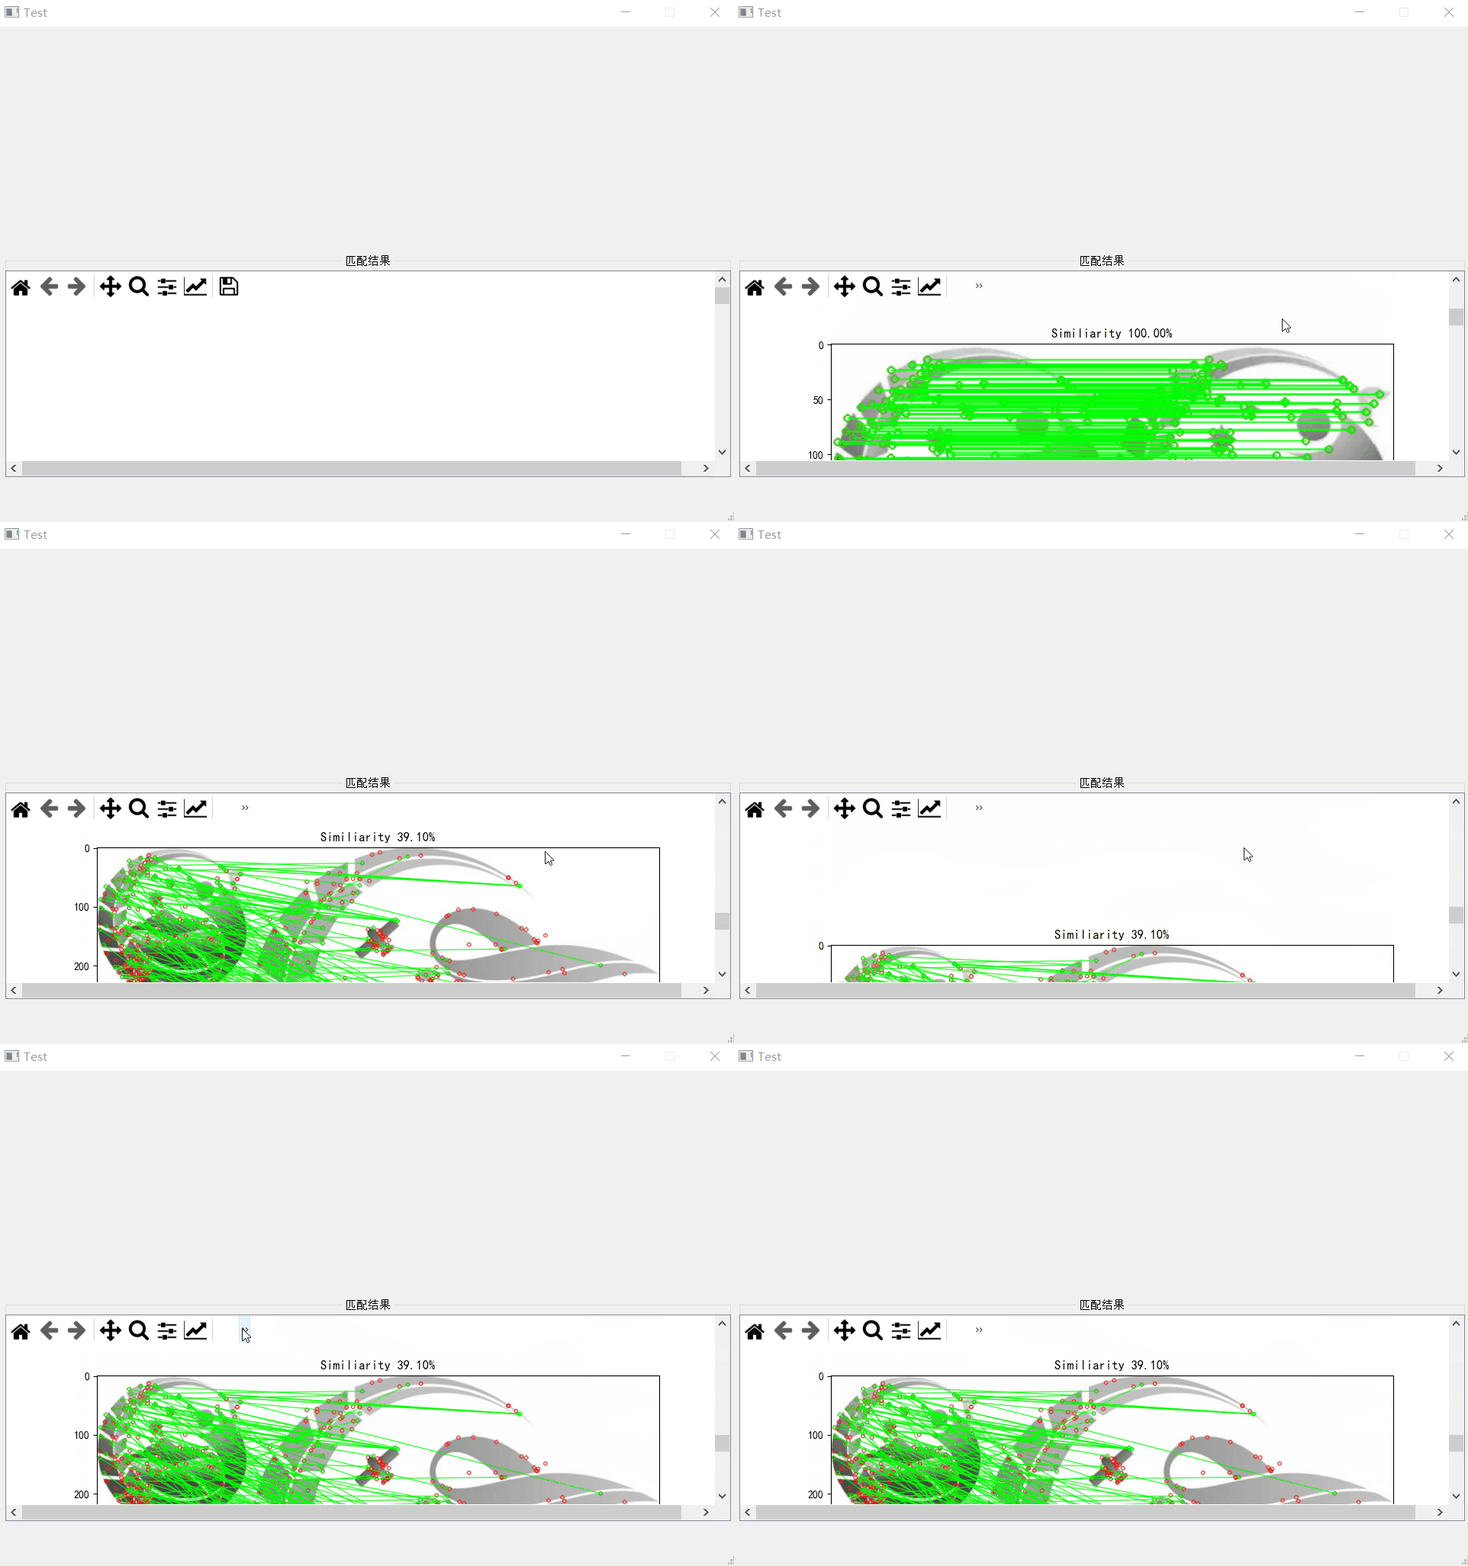
matplotlib库是一个常用的数据可视化库。我们在做桌面应用的时候有时候需要数据的展现也可以使用matplotlib中。那么怎么使用pyqt实现将matplotlib图像嵌入scollarea中并显示滚动条呢?接下来这篇文章带你了解。
前言
如题目所述,又是花费了两天的时间实现了该功能,本来今天下午有些心灰意冷,打算放弃嵌入到Scoll Area中的想法,但最后还是心里一紧,仔细梳理了一下逻辑,最终实现了功能
效果展示

注意:当你想实现一个子功能的时候,可以从新创建两个文件:
×××.ui文件(如上图效果展示是和我项目里的位置一样的)×××.py文件(用来实现功能)
截图

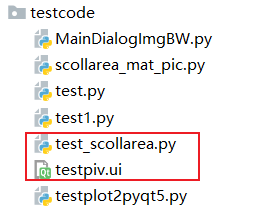
如上图所示,
红色框里的文件是实现效果展示的所有源文件。但是文件夹testcode是为了实现将Matplotlib图像嵌入到Scoll Area中所做的所有工作,稍后我会将参考资源放入文章末尾
一、解决步骤
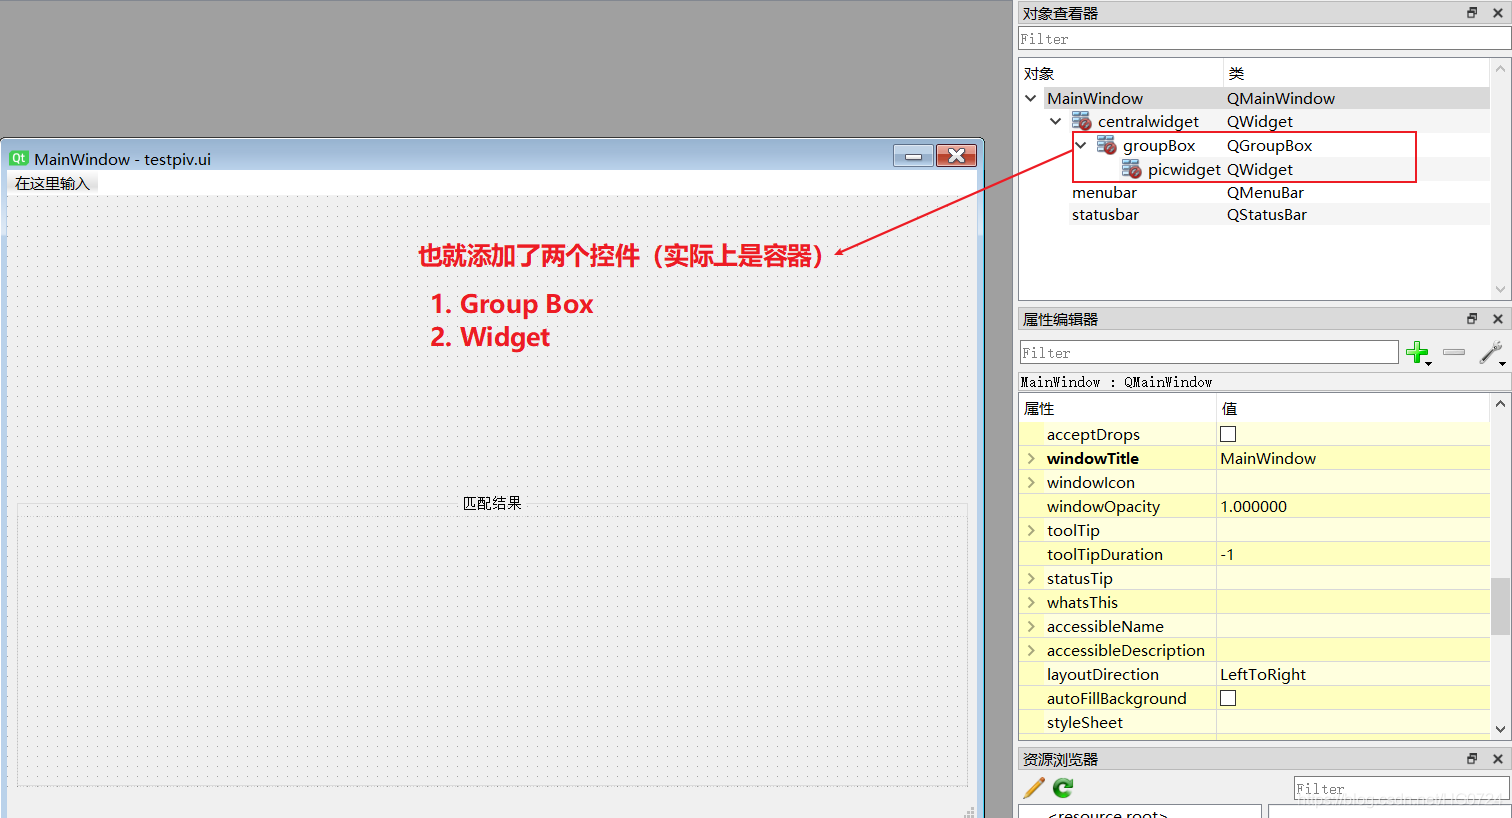
1.1 qt designer
设计ui文件,控件的位置需要和自己项目中控件的位置相同,以便功能实现后方便项目调用

保存为
testpiv.ui文件
1.2 pycharm编写程序
代码
import cv2
import os
import sys
import math


from PyQt5 import QtCore
from PyQt5.QtWidgets import *
from PyQt5.uic import loadUi

import matplotlib
from matplotlib import pyplot as plt
matplotlib.use("Qt5Agg")  # 声明使用QT5
from matplotlib.backends.backend_qt5agg import FigureCanvasQTAgg as FigureCanvas
matplotlib.use("Qt5Agg")  # 声明使用QT5
from matplotlib.backends.backend_qt5agg import NavigationToolbar2QT as NavigationToolbar


#创建一个matplotlib图形绘制类
class MyFigure(FigureCanvas):
    def __init__(self,width, height, dpi):
         # 创建一个Figure,该Figure为matplotlib下的Figure,不是matplotlib.pyplot下面的Figure
        self.fig = plt.figure(figsize=(width, height), dpi=dpi)
         # 在父类中激活Figure窗口,此句必不可少,否则不能显示图形
        super(MyFigure,self).__init__(self.fig)
         # 调用Figure下面的add_subplot方法,类似于matplotlib.pyplot下面的subplot(1,1,1)方法


class scollarea_showpic(QMainWindow):

    def __init__(self, queryPath=None, samplePath=None,limit_value = None):
        super().__init__()
        self.queryPath = queryPath  # 图库路径
        self.samplePath = samplePath  # 样本图片
        self.limit_value = limit_value
        self.ui()

        plt.rcParams['font.sans-serif'] = ['KaiTi']  # 只有这样中文字体才可以显示

    def ui(self):
        loadUi('./testpiv.ui', self)
        self.SIFT(self.queryPath,self.samplePath,self.limit_value)

    def getMatchNum(self,matches,ratio):
        '''返回特征点匹配数量和匹配掩码'''
        matchesMask=[[0,0] for i in range(len(matches))]
        matchNum=0
        for i,(m,n) in enumerate(matches):
            if m.distance < ratio * n.distance: #将距离比率小于ratio的匹配点删选出来
                matchesMask[i]=[1,0]
                matchNum+=1
        return (matchNum,matchesMask)

    def SIFT(self,dirpath,picpath,limit_value):
        # path='F:/python/gradu_design/gra_des/'

        queryPath=dirpath #图库路径
        samplePath=picpath  #样本图片

        comparisonImageList=[] #记录比较结果

        #创建SIFT特征提取器
        sift = cv2.xfeatures2d.SIFT_create()

        #创建FLANN匹配对象

        """
        FLANN是类似最近邻的快速匹配库
            它会根据数据本身选择最合适的算法来处理数据
            比其他搜索算法快10倍
        """
        FLANN_INDEX_KDTREE=0
        indexParams=dict(algorithm=FLANN_INDEX_KDTREE,trees=5)
        searchParams=dict(checks=50)
        flann=cv2.FlannBasedMatcher(indexParams,searchParams)

        sampleImage=cv2.imread(samplePath,0)
        kp1, des1 = sift.detectAndCompute(sampleImage, None) #提取样本图片的特征
        for parent,dirnames,filenames in os.walk(queryPath):
            print('parent :',parent,'   ','dirnames :',dirnames)
            for p in filenames:
                p=queryPath+p
                # print('pic file name :',p)
                queryImage=cv2.imread(p,0)

                kp2, des2 = sift.detectAndCompute(queryImage, None) #提取比对图片的特征

                matches=flann.knnMatch(des1,des2,k=2) #匹配特征点,为了删选匹配点,指定k为2,这样对样本图的每个特征点,返回两个匹配

                (matchNum,matchesMask) = self.getMatchNum(matches,0.9) #通过比率条件,计算出匹配程度
                matchRatio=matchNum*100/len(matches)
                drawParams=dict(matchColor=(0,255,0),
                        singlePointColor=(255,0,0),
                        matchesMask=matchesMask,
                        flags=0)
                comparisonImage=cv2.drawMatchesKnn(sampleImage,kp1,queryImage,kp2,matches,None,**drawParams)
                comparisonImageList.append((comparisonImage,matchRatio)) #记录下结果

        comparisonImageList.sort(key=lambda x:x[1],reverse=True) #按照匹配度排序  降序

        new_comparisonImageList = comparisonImageList[:limit_value]
        count=len(new_comparisonImageList)

        column = 1 # 列
        row = math.ceil(count/column) # 行   math.ceil: 函数返回大于或等于一个给定数字的最小整数
        print('列:',column,  '  ','行:',row)

        #绘图显示
        F = MyFigure(width=10, height=10, dpi=100)  # 500 * 400

        for index,(image,ratio) in enumerate(new_comparisonImageList):
            F.axes = F.fig.add_subplot(row,column,index+1)
            F.axes.set_title('Similiarity %.2f%%' % ratio)
            plt.imshow(image)
            # 调整subplot之间的间隙大小
            plt.subplots_adjust(hspace=0.2)

        self.figure = F.fig
        # FigureCanvas:画布
        self.canvas = FigureCanvas(self.figure)  # fig 有 canvas
        self.canvas.resize(self.picwidget.width(), 3000) # 画布大小
        self.scrollArea = QScrollArea(self.picwidget)  # picwidget上有scroll
        self.scrollArea.setFixedSize(self.picwidget.width(), self.picwidget.height())
        self.scrollArea.setWidget(self.canvas)  # widget上有scroll   scroll有canvas

        self.nav = NavigationToolbar(self.canvas, self.picwidget)  # 创建工具栏

        self.setMinimumSize(self.width(), self.height())
        self.setMaximumSize(self.width(), self.height())
        self.setWindowTitle('Test')
if __name__ == "__main__":
    app = QApplication(sys.argv)
    queryPath='F:/python/gradu_design/gra_des/imges/' #图库路径
    samplePath='F:/python/gradu_design/gra_des/imges/resized_logo1_1.jpg'  #样本图片
    main = scollarea_showpic(queryPath,samplePath,3)
    main.show()

    sys.exit(app.exec_())
总结
从目前我的认知来讲,你想要实现的功能,基本上换一种思路、想法,都是可能会有解决方案的,只不过可能难度不同,你需要投入的精力不同。
结合本篇博客来说,从我产生这个想法来说,我一直在找资料,从一开始的简单搜索同一个内容到后面转变搜索思路,到最后梳理逻辑框架、代码,最后实现功能,此过程耗费的时间(两天多)不算长,但也不算短。中间的过程是煎熬的,几次试图想放弃,最后还是挺了过来,还是很开心的。
只要不放弃,你就可以!
以上就是怎么使用pyqt实现将matplotlib图像嵌入scollarea中并显示滚动条的详细内容,更多PyQt5的使用介绍请关注W3Cschool其它相关文章!

 免费AI编程助手


